 |
TROPICAL WEATHER LINKS |
 |


 |
TROPICAL WEATHER LINKS |
 |


FAQ--
| The North Atlantic Ocean tropical cyclone basin is considered to be that area north of 0o between 0o west and the North American and Central American east coasts. | |
| The "season" extends from June through November, although there have been tropical cyclones recorded in every month. | |
| The area of the Atlantic basin observing the maximum number of hurricanes is near 29.0N, 75.5W, approximately 325 miles east of the central Florida east coast. | |
| The median start date for the "season" is June 30, the median end date is October 30. | |
| Since 1899 329 tropical cyclones have crossed the coastline between Maine and Texas. | |
| Since 1899 168 category 1 through 5 hurricanes have crossed the coastline from Maine to Texas. |
All Hurricanes are dangerous, but some are more so than others. The way storm surge, wind and other factors combine determines the hurricanes destructive power. To make comparisons easier and to make the predicted hazards of approaching hurricanes clearer to emergency managers, National Oceanic and Atmospheric Administration's hurricane forecasters use a disaster-potential scale which assigns storms to five categories. This can be used to give an estimate of the potential property damage and flooding expected along the coast with a hurricane.
The scale was formulated in 1969 by Herbert Saffir, a consulting engineer, and Dr. Bob Simpson, director of the National Hurricane Center. The World Meteorological Organization was preparing a report on structural damage to dwellings due to windstorms, and Dr. Simpson added information about storm surge heights that accompany hurricanes in each category.
| CATEGORY | PRESSURE | WINDS | SURGE | EFFECTS |
|---|---|---|---|---|
| TD | -- | <=38 mph | -- | No real damage |
| TS | -- | 39-73 mph | -- | Damage is minimal |
| One | 980 mB+ | 74-95 mph | 4-5 ft | No real damage to building structures. Damage primarly to unanchored mobile homes, shrubbery, and trees. Also, some coastal road flooding and minor pier damage. |
| Two | 965-980 mB | 96-110 mph | 6-8 ft | Some roofing material, door, and window damage to buildings. Considerable damage to vegetation, mobile homes, and piers. Coastal and low-lying escape routes flood 2-4 hours before arrival of center. Small craft in unprotected anchorages break moorings. |
| Three | 945-965 mB | 111-130 mph | 9-12 ft | Some structural damage to small residences and utility buildings with a minor amount of curtainwall failures. Mobile homes are destroyed. Flooding near the coast destroys smaller structures with larger structures damaged by floating debris. Terrain continuously lower than 5 feet ASL may be flooded inland 8 miles or more. |
| Four | 920-945 mB | 131-155 mph | 13-18 ft | More extensive curtainwall failures with some complete roof strucutre failure on small residences. Major erosion of beach. Major damage to lower floors of structures near the shore. Terrain continuously lower than 10 feet ASL may be flooded requiring massive evacuation of residential areas inland as far as 6 miles. |
| Five | < 920 mB | greater than 155 mph | 18+ ft | Complete roof failure on many residences and industrial buildings. Some complete building failures with small utility buildings blown over or away. Major damage to lower floors of all structures located less than 15 feet ASL and within 500 yards of the shoreline. Massive evacuation of residential areas on low ground within 5 to 10 miles of the shoreline may be required. |
| Category | Sustained Winds (MPH) |
Description | Examples | |
|---|---|---|---|---|
| 1 | Minimal | Allison (1995) | Danny (1997) | ||
| 2 | Moderate | Bonnie (1998) NC | Georges (1998) FL & MS | ||
| 3 | Extensive | Roxanne (1995) Yuc. Pen. | Fran (1996) NC | ||
| 4 | Extreme | Andrew 1992 (FL) | Hugo (1989) SC | ||
| 5 | Catastrophic | Mitch (1998) Hond. | Gilbert (1988) Yuc. Pen. |

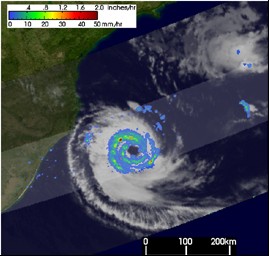
NASA NCDC Catarina Visible Loop (gif)
NASA NCDC Catarina IR4 Loop (Java 40 pix)
Brazilian Catarina page
Catarina Article from Science.NASA.gov

 |
 |
 |
 |
 |